Sunday, April 16, 2017

Week 13 Drake

Blog sheet Week 13:


1. Provide the updated computer drawing for your individual RG setup.


2. Explain your setup.

In my setup, Mohammad's Rube Goldberg device ends with dominoes that will start my motor which will release the marble ball down the mechanical device I created, and it will flip the switch once it reaches the goal.  Once the switch is flipped, my second relay is triggered which will start Liam's Rube Goldberg device by knocking over his dominoes.

3. Provide photos of the circuit and setup.

Above is the mechanical device and below is a video of the whole circuit.


4. Provide at least 2 new videos of your setup in action, one being a failed attempt.


The video above is the successful circuit.  You can't really see the light or the goal turn on, but it worked.  Below was a failed attempt.  The reason that it failed was because the ball didn't flip the switch hard enough and it failed to work.


Above is another failed attempt that I had, not while the whole design was running but when I was designing the switch to turn the goal on.  I had accidentally installed the switch backwards so instead of it turning on to say "GOAL" it was already on and pressing the switch turned it off.

5. What failures did you have? How did you overcome them?

One of the biggest failures that I had was when the ball came down the ramps that it wasn't getting enough power to flip the switch and turn on the second relay/LED/GOAL.  The reason that this was happening was because the ramps were too wide.  The marble was losing energy while it was going down the ramps and instead, I skinnied up the ramps, and the marble had a direct path to hitting and flipping the switch.

6. Group task: Explain your group RG setup.


Mohammad is applying a light to the photosensor and the PS makes the relay turn on, then the relay turns on the motor which drops his dominoes and then triggers my switch which turns on my motor that releases the ball.  The ball goes down my mechanical device and finally triggers my second switch, which lights up the letters "GOAL" on my second circuit board, triggers the relay, and starts my timer.  Once my timer is done it will start my second motor, which will knock over dominoes and start Liam's circuit.

This RG trial of mine failed because we forgot to turn the power on.  Also the marble didn't trigger my second switch anyways so I had to modify the track that the ball went on to make it more direct to the switch.


This trial ran perfectly.  I modified the track and the marble has a 100% direct path to the switch so it will not fail.


7. Group task: Video of a test run of your group RG.


Friday, April 14, 2017

Week 13 Mohammad

Blog sheet Week 13:

This week’s blog sheet will be both individual and group.

Your blogsheet 13 tasks:

1. Provide the updated computer drawing for your individual RG setup.


2. Explain your setup.

in my RG i am going to start with the photo sensor which is covered by a paper so if i move the paper the opamp is going to send voltage to the relay which is going to make the motor work the motor will pull the ball to hit the domino in the middle of the domino there is a force sensing resistor which is going to make both 7 sigma displays work and show a word GO.
3. Provide photos of the circuit and setup.


4. Provide at least 2 new videos of your setup in action, one being a failed attempt.


5. What failures did you have? How did you overcome them?
the first failure is that the motor didn't receive voltage from the relay i was thinking that i might made a wrong connection in the circuit so i cheek that and i didn't find any thing wrong so i changed the relay for three times and i found finally that the three relays that i tried is not working.

the second failure is that i didn't find way that make a connection between the the photo sensor and the relay i used the opamp to send the voltage but that also didn't work with me i am still searching about the way that i can connect these.

the third failure is the the FSR need a heavy weight to make the 7 sigma displays work i was using 330 ohms resistor so that was too much so ichanged them to put 82 ohm resistor so now is better than before and the seven sigma displays work with me well.


Mohammad is applying a light to the photosensor and the PS makes the relay turn on, then the relay turns on the motor which drops his dominoes and then triggers my switch which turns on my motor that releases the ball.  The ball goes down my mechanical device and finally triggers my second switch, which lights up the letters "GOAL" on my second circuit board, triggers the relay, and starts my timer.  Once my timer is done it will start my second motor, which will knock over dominoes and start Liam's circuit.


We forgot to turn on the power^^


This worked perfectly^^

Sunday, April 9, 2017

Week 12 Drake

Blog Sheet Week 12 - Drake


1. Provide the computer drawing for your individual RG setup.


2. Explain your setup.

In the RG setup that I created it starts with the switch that triggers the relay.  Once the relay is triggered the motor starts and will release the marble.  The marble goes down the ramps of my mechanical device and enters inside the goal.  Inside the goal the marble will flip my second switch, and on my circuit board GOAL is lit up, and the LED lights up on top of the goal.  The second relay is also triggered to go onto the next RG setup.  

3. Provide photos of the circuit and setup.


4. Provide at least 2 videos of your setup in action (parts or whole), at least one being a failed attempt.


Above is a successful attempt.


The circuit above was a failed attempt.  It failed because the ball was very wobbly down the ramp and didn't have a direct path to the switch.


This is a fail when I was designing the circuit.  I had made the mistake of turning the relay and GOAL off when the switch was turned.

5. What failures did you have? How did you overcome them?

The biggest failure that I had was having enough power from the marble to trigger the switch and turn on the second circuit board.  The ramp was a little big, so the marble didn't necessarily have the most direct path to hit the switch.  I overcame it by making the ramp skinnier and adding tape to the ramp which decreased friction on the ramp and allowed the ball to travel faster.  At first I wanted a bigger ball, but I realized that the equation 1/2mv^2 means that the more power would be because of a higher velocity not a bigger ball, so I maxed the velocity as much as I could from the ball.  

Monday, April 3, 2017

Week 12 Mohammad

Blog sheet Week 12:
This week’s blog sheet will be individual but you will post it on your group blog.
Your individual Rube Goldberg (RG) setup should satisfy the following:
1. Use at least 5 of the following components:
a. Transistor
b. OPAMP
c. Relay
d. Temperature sensor
e. Photosensor
f. Motor
g. Display
h. Strain gauge
i. Speaker
j. Microphone
k. Solar panel
2. Use a new circuit: It can be a modification to one of our lab circuits.
3. Let your system complete its task in no shorter than 10 seconds.
4. Make sure you are compatible with your preceding and following RG stage.

1. Provide the computer drawing for your individual RG setup.


2. Explain your setup.
in my RG i am going to start with the photo sensor which is covered by a paper so if i move the paper the opamp is going to send voltage to the relay which is going to make the motor work the motor will pull the ball to hit the domino in the middle of the domino there is a force sensing resistor which is going to make both 7 sigma displays work and show a word GO.

3. Provide photos of the circuit and setup.


4. Provide at least 2 videos of your setup in action (parts or whole), at least one being a failed attempt.


5. What failures did you have? How did you overcome them?

the first failure is that the motor didn't receive voltage from the relay i was thinking that i might made a wrong connection in the circuit so i cheek that and i didn't find any thing wrong so i changed the relay for three times and i found finally that the three relays that i tried is not working.

the second failure is that i didn't find way that make a connection between the the photo sensor and the relay i used the opamp to send the voltage but that also didn't work with me i am still searching about the way that i can connect these.

the third failure is the the FSR need a heavy weight to make the 7 sigma displays work i was using 330 ohms resistor so that was too much so ichanged them to put 82 ohm resistor so now is better than before and the seven sigma displays work with me well.
 

Monday, March 27, 2017

Week 11

Blog sheet Week 11: Strain Gauges

Part A: Strain Gauges:

Strain gauges are used to measure the strain or stress levels on the materials. Alternatively, pressure on the strain gauge causes a generated voltage and it can be used as an energy harvester. You will be given either the flapping or tapping type gauge. When you test the circle buzzer type gauge, you will lay it flat on the table and tap on it. If it is the long rectangle one, you will flap the piece to generate voltage.

1. Connect the oscilloscope probes to the strain gauge. Record the peak voltage values (positive and negative) by flipping/tapping the gauge with low and high pressure. Make sure to set the oscilloscope horizontal and vertical scales appropriately so you can read the values. DO NOT USE the measure tool of the oscilloscope. Adjust your oscilloscope so you can read the values from the screen.
Fill out Table 1 and provide photos of the oscilloscope.


Flipping strength
Minimum Voltage
Maximum Voltage
Low
 -0.5 V
3 V
High
 -3.8 V
 6.4 V


2. Press the single button below the Autoscale button on the oscilloscope. This mode will allow you to capture a single change at the output. Adjust your time and amplitude scales so you have the best resolution for your signal when you flip/tap your strain gauge. Provide a photo of the oscilloscope graph.


Part B: Half-Wave Rectifiers

1. Construct the following half-wave rectifier. Measure the input and the output using the oscilloscope and provide a snapshot of the outputs.


2. Calculate the effective voltage of the input and output and compare the values with the measured ones by completing the following table.
Effective (rms) values
Calculated
Measured
Input
7.07 V
7.18 V
Output
3.54 V
3.59 V

3. Explain how you calculated the rms values. Do calculated and measured values match?

We calculated the RMS input value by Voltage / sqrt(2), and we calculated the RMS output value by dividing the inputs by 2.  Our calculated and measured values are VERY close.  I would say that they match just based on probable random error that will occur in the circuit.    

4. Construct the following circuit and record the output voltage using both DMM and the oscilloscope.


Oscilloscope
DMM
Output Voltage (p-p)
 4.8 V
 4.59 V
Output Voltage (mean)
 6.12 V
 6.03 V


5. Replace the 1 µF capacitor with 100 µF and repeat the previous step. What has changed?


Oscilloscope
DMM
Output Voltage (p-p)
 0 V
 0 V
Output Voltage (mean)
 7.04 V
 6.88 V


Part C: Energy Harvesters

1. Construct the half-wave rectifier circuit without the resistor but with the 1 µF capacitor. Instead of the function generator, use the strain gauge. Discharge the capacitor every time you start a new measurement. Flip/tap your strain gauge and observe the output voltage. Fill out the table below:


Tap frequency
Duration
Output voltage
1 flip/second
10 seconds
 744 mV
1 flip/second
20 seconds
 1.26 V
1 flip/second
30 seconds
 1.48 V
4 flips/second
10 seconds
 2.3 V
4 flips/second
20 seconds
 2.86 V
4 flips/second
30 seconds
 3.41 V

2. Briefly explain your results.

It was sort of difficult to make sure that you got consistent taps, and I feel like my finger missed the sensor once or twice when I was tapping... The plot looks linear though.  It looks like your voltage output will be consistent with the number of taps you use but it didn't seem to level off until we got over 3.2 volts.  I think for me, because of my big fingers, someone with a smaller finger or maybe a bigger sensor would create a more consistent output.  

3. If we do not use the diode in the circuit (i.e. using only strain gauge to charge the capacitor), what would you observe at the output? Why?

You get very small output levels.  This is because without the diode the voltage will remain in AC, so there is a negative part of the voltage that will cancel out the higher voltage level that would be shown in the output.  The highest voltage level we achieved without the diode was 121 mV. 

4. Write a MATLAB code to plot the date in table of Part C1.


Monday, March 20, 2017

Week 10

PART A: MATLAB practice.
1. Open MATLAB. Open the editor and copy paste the following code. Name your code as FirstCode.m
Save the resulting plot as a JPEG image and put it here.
clear all;
close all;
x = [1 2 3 4 5];
y = 2.^x;
plot(x, y, 'LineWidth', 6)
xlabel('Numbers', 'FontSize', 12)
ylabel('Results', 'FontSize', 12)


2. What does clear all do?
it will clear everything include all the variable and the commend window.

3. What does close all do?
it will close all the figure windows that are open.

4. In the command line, type x and press enter. This is a matrix. How many rows and columns are there in the matrix?
1 row and 5 columns

5. Why is there a semicolon at the end of the line of x and y?
when we typed the semicolon at the end of the line of x and y that to make sure that the output of the commend is not displayed, and just to make sure when the output is very large.

6. Remove the dot on the y = 2.^x; line and execute the code again. What does the error message mean?
Error using  ^ 
Inputs must be a scalar and a square matrix.

To compute elementwise POWER, use POWER (.^) instead.
the eror showed that we must use the dot in order to not get eror in this equation and getting the right graph.
7. How does the LineWidth affect the plot? Explain.
we used the LineWidth to specify the width of the line in the plot.  We can make the bigger or thinner that depends in the point we upload.
8. Type help plot on the command line and study the options for plot command. Provide how you would change the line for plot command to obtain the following figure (Hint: Like ‘LineWidth’, there is another property called ‘MarkerSize’)


To change the width of the line, the last number (which is number 6/default in the code) needs to be changed.  To obtain a thicker line a higher number needs to be in instead of the 6, and to get a smaller number a smaller number than 6 needs to be used.

9. What happens if you change the line for x to x = [1; 2; 3; 4; 5]; ? Explain.

The only thing that changes is that the row vector is changed into a column vector, but nothing changes on the graph.  No visual changes, nothing...

10. Provide the code for the following figure. You need to figure out the function for y. Notice there are grids on the plot.
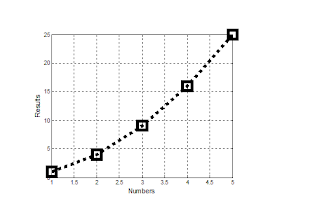


clear all;
close all;
x = [1; 2; 3; 4; 5];
y = x.^2;
plot(x, y, ':sk','LineWidth', 6, 'MarkerSize', 19)
grid
xlabel('Numbers', 'FontSize', 12)

ylabel('Results', 'FontSize', 12)


11. Degree vs. radian in MATLAB:

a. Calculate sinus of 30 degrees using a calculator or internet.
using the calculator we got 0.5

b. Type sin(30) in the command line of the MATLAB. Why is this number different? (Hint: MATLAB treats angles as radians).
when we type sin(30) in the matlab we got -0.9880

c. How can you modify sin(30) so we get the correct number?
if we add d after sin we will change the calculation from radians to degrees
sind(30)=0.5

12. Plot y = 10 sin (100 t) using Matlab with two different resolutions on the same plot: 10 points per period and 1000 points per period. The plot needs to show only two periods. Commands you might need to use are linspace, plot, hold on, legend, xlabel, and ylabel. Provide your code and resulting figure. The output figure should look like the following:


t=linspace(0,0.126,10);
y=10*sin(100*t);
x=linspace(0,0.126,1000);
z=10*sin(100*x);
plot(t,y,'-ro',x,z,'k')
axis([0 0.14 -10 10])
xlabel('Time(S)')
ylabel('y function')

legend('Course','Fine')


13. Explain what is changed in the following plot comparing to the previous one.


by making the fine function equal or greater than 5.


14. The command find was used to create this code. Study the use of find (help find) and try to replicate the plot above. Provide your code.


PART B: Filters and MATLAB

1. Build a low pass filter using a resistor and capacitor in which the cut off frequency is 1 kHz. Observe the output signal using the oscilloscope. Collect several data points particularly around the cut off frequency. Provide your data in a table.
Frequency(kHz)
V(out) (V)
(V(out)/V(in)) (V)
0
0
0
0.1
3.764
1.08
0.2
3.643
1.04
0.2
3.509
1.002
0.4
3.372
0.963
0.5
3.162
0.903
0.6
2.959
0.845
0.7
2.768
0.791
0.8
2.572
0.735
0.9
2.406
0.687
1.0
2.257
0.645
1.1
2.096
0.599
1.2
1.963
0.561
1.3
1.846
0.527
1.4
1.743
0.498
1.5
1.634
0.466
1.6
1.582
0.452
1.7
1.471
0.420
1.8
1.390
0.397

2. Plot your data using MATLAB. Make sure to use proper labels for the plot and make your plot line and fonts readable. Provide your code and the plot.


3. Calculate the cut off frequency using MATLAB. find command will be used. Provide your code.
A=find(z>0.68)
B=x(A);
C=z(A);
D=find(C<0.72);
fC=B(D);
fprintf ('Cutoff Frequency = %1.1f kHz' fc)

the cut off frequency we get from the matlab is 0.9kHz

5. Repeat 1-3 by modifying the circuit to a high pass filter.


Frequency(kHz)
V(out) (V)
(V(out)/V(in)) (V)
0
0
0
0.1
0.588
0.168
0.2
0.976
0.279
0.2
1.345
0.384
0.4
1.568
0.448
0.5
1.866
0.533
0.6
2.122
0.606
0.7
2.244
0.641
0.8
2.421
0.692
0.9
2.512
0.712
1.0
2.591
0.740
1.1
2.624
0.749
1.2
2.697
0.771
1.3
2.725
0.779
1.4
2.769
0.791
1.5
2.791
0.797
1.6
2.811
0.803
1.7
2.829
0.808
1.8
2.837
0.811


3. Calculate the cut off frequency using MATLAB. find command will be used. Provide your code.
A=find(z>0.68)
B=x(A);
C=z(A);
D=find(C<0.72);
fC=B(D);
fprintf ('Cutoff Frequency = %1.1f kHz' fc)

the cut off frequency we get from the matlab is 0.9kHz