Monday, March 27, 2017

Week 11

Blog sheet Week 11: Strain Gauges

Part A: Strain Gauges:

Strain gauges are used to measure the strain or stress levels on the materials. Alternatively, pressure on the strain gauge causes a generated voltage and it can be used as an energy harvester. You will be given either the flapping or tapping type gauge. When you test the circle buzzer type gauge, you will lay it flat on the table and tap on it. If it is the long rectangle one, you will flap the piece to generate voltage.

1. Connect the oscilloscope probes to the strain gauge. Record the peak voltage values (positive and negative) by flipping/tapping the gauge with low and high pressure. Make sure to set the oscilloscope horizontal and vertical scales appropriately so you can read the values. DO NOT USE the measure tool of the oscilloscope. Adjust your oscilloscope so you can read the values from the screen.
Fill out Table 1 and provide photos of the oscilloscope.


Flipping strength
Minimum Voltage
Maximum Voltage
Low
 -0.5 V
3 V
High
 -3.8 V
 6.4 V


2. Press the single button below the Autoscale button on the oscilloscope. This mode will allow you to capture a single change at the output. Adjust your time and amplitude scales so you have the best resolution for your signal when you flip/tap your strain gauge. Provide a photo of the oscilloscope graph.


Part B: Half-Wave Rectifiers

1. Construct the following half-wave rectifier. Measure the input and the output using the oscilloscope and provide a snapshot of the outputs.


2. Calculate the effective voltage of the input and output and compare the values with the measured ones by completing the following table.
Effective (rms) values
Calculated
Measured
Input
7.07 V
7.18 V
Output
3.54 V
3.59 V

3. Explain how you calculated the rms values. Do calculated and measured values match?

We calculated the RMS input value by Voltage / sqrt(2), and we calculated the RMS output value by dividing the inputs by 2.  Our calculated and measured values are VERY close.  I would say that they match just based on probable random error that will occur in the circuit.    

4. Construct the following circuit and record the output voltage using both DMM and the oscilloscope.


Oscilloscope
DMM
Output Voltage (p-p)
 4.8 V
 4.59 V
Output Voltage (mean)
 6.12 V
 6.03 V


5. Replace the 1 µF capacitor with 100 µF and repeat the previous step. What has changed?


Oscilloscope
DMM
Output Voltage (p-p)
 0 V
 0 V
Output Voltage (mean)
 7.04 V
 6.88 V


Part C: Energy Harvesters

1. Construct the half-wave rectifier circuit without the resistor but with the 1 µF capacitor. Instead of the function generator, use the strain gauge. Discharge the capacitor every time you start a new measurement. Flip/tap your strain gauge and observe the output voltage. Fill out the table below:


Tap frequency
Duration
Output voltage
1 flip/second
10 seconds
 744 mV
1 flip/second
20 seconds
 1.26 V
1 flip/second
30 seconds
 1.48 V
4 flips/second
10 seconds
 2.3 V
4 flips/second
20 seconds
 2.86 V
4 flips/second
30 seconds
 3.41 V

2. Briefly explain your results.

It was sort of difficult to make sure that you got consistent taps, and I feel like my finger missed the sensor once or twice when I was tapping... The plot looks linear though.  It looks like your voltage output will be consistent with the number of taps you use but it didn't seem to level off until we got over 3.2 volts.  I think for me, because of my big fingers, someone with a smaller finger or maybe a bigger sensor would create a more consistent output.  

3. If we do not use the diode in the circuit (i.e. using only strain gauge to charge the capacitor), what would you observe at the output? Why?

You get very small output levels.  This is because without the diode the voltage will remain in AC, so there is a negative part of the voltage that will cancel out the higher voltage level that would be shown in the output.  The highest voltage level we achieved without the diode was 121 mV. 

4. Write a MATLAB code to plot the date in table of Part C1.


Monday, March 20, 2017

Week 10

PART A: MATLAB practice.
1. Open MATLAB. Open the editor and copy paste the following code. Name your code as FirstCode.m
Save the resulting plot as a JPEG image and put it here.
clear all;
close all;
x = [1 2 3 4 5];
y = 2.^x;
plot(x, y, 'LineWidth', 6)
xlabel('Numbers', 'FontSize', 12)
ylabel('Results', 'FontSize', 12)


2. What does clear all do?
it will clear everything include all the variable and the commend window.

3. What does close all do?
it will close all the figure windows that are open.

4. In the command line, type x and press enter. This is a matrix. How many rows and columns are there in the matrix?
1 row and 5 columns

5. Why is there a semicolon at the end of the line of x and y?
when we typed the semicolon at the end of the line of x and y that to make sure that the output of the commend is not displayed, and just to make sure when the output is very large.

6. Remove the dot on the y = 2.^x; line and execute the code again. What does the error message mean?
Error using  ^ 
Inputs must be a scalar and a square matrix.

To compute elementwise POWER, use POWER (.^) instead.
the eror showed that we must use the dot in order to not get eror in this equation and getting the right graph.
7. How does the LineWidth affect the plot? Explain.
we used the LineWidth to specify the width of the line in the plot.  We can make the bigger or thinner that depends in the point we upload.
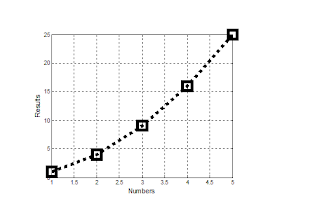
8. Type help plot on the command line and study the options for plot command. Provide how you would change the line for plot command to obtain the following figure (Hint: Like ‘LineWidth’, there is another property called ‘MarkerSize’)


To change the width of the line, the last number (which is number 6/default in the code) needs to be changed.  To obtain a thicker line a higher number needs to be in instead of the 6, and to get a smaller number a smaller number than 6 needs to be used.

9. What happens if you change the line for x to x = [1; 2; 3; 4; 5]; ? Explain.

The only thing that changes is that the row vector is changed into a column vector, but nothing changes on the graph.  No visual changes, nothing...

10. Provide the code for the following figure. You need to figure out the function for y. Notice there are grids on the plot.


clear all;
close all;
x = [1; 2; 3; 4; 5];
y = x.^2;
plot(x, y, ':sk','LineWidth', 6, 'MarkerSize', 19)
grid
xlabel('Numbers', 'FontSize', 12)

ylabel('Results', 'FontSize', 12)


11. Degree vs. radian in MATLAB:

a. Calculate sinus of 30 degrees using a calculator or internet.
using the calculator we got 0.5

b. Type sin(30) in the command line of the MATLAB. Why is this number different? (Hint: MATLAB treats angles as radians).
when we type sin(30) in the matlab we got -0.9880

c. How can you modify sin(30) so we get the correct number?
if we add d after sin we will change the calculation from radians to degrees
sind(30)=0.5

12. Plot y = 10 sin (100 t) using Matlab with two different resolutions on the same plot: 10 points per period and 1000 points per period. The plot needs to show only two periods. Commands you might need to use are linspace, plot, hold on, legend, xlabel, and ylabel. Provide your code and resulting figure. The output figure should look like the following:


t=linspace(0,0.126,10);
y=10*sin(100*t);
x=linspace(0,0.126,1000);
z=10*sin(100*x);
plot(t,y,'-ro',x,z,'k')
axis([0 0.14 -10 10])
xlabel('Time(S)')
ylabel('y function')

legend('Course','Fine')


13. Explain what is changed in the following plot comparing to the previous one.


by making the fine function equal or greater than 5.


14. The command find was used to create this code. Study the use of find (help find) and try to replicate the plot above. Provide your code.


PART B: Filters and MATLAB

1. Build a low pass filter using a resistor and capacitor in which the cut off frequency is 1 kHz. Observe the output signal using the oscilloscope. Collect several data points particularly around the cut off frequency. Provide your data in a table.
Frequency(kHz)
V(out) (V)
(V(out)/V(in)) (V)
0
0
0
0.1
3.764
1.08
0.2
3.643
1.04
0.2
3.509
1.002
0.4
3.372
0.963
0.5
3.162
0.903
0.6
2.959
0.845
0.7
2.768
0.791
0.8
2.572
0.735
0.9
2.406
0.687
1.0
2.257
0.645
1.1
2.096
0.599
1.2
1.963
0.561
1.3
1.846
0.527
1.4
1.743
0.498
1.5
1.634
0.466
1.6
1.582
0.452
1.7
1.471
0.420
1.8
1.390
0.397

2. Plot your data using MATLAB. Make sure to use proper labels for the plot and make your plot line and fonts readable. Provide your code and the plot.


3. Calculate the cut off frequency using MATLAB. find command will be used. Provide your code.
A=find(z>0.68)
B=x(A);
C=z(A);
D=find(C<0.72);
fC=B(D);
fprintf ('Cutoff Frequency = %1.1f kHz' fc)

the cut off frequency we get from the matlab is 0.9kHz

5. Repeat 1-3 by modifying the circuit to a high pass filter.


Frequency(kHz)
V(out) (V)
(V(out)/V(in)) (V)
0
0
0
0.1
0.588
0.168
0.2
0.976
0.279
0.2
1.345
0.384
0.4
1.568
0.448
0.5
1.866
0.533
0.6
2.122
0.606
0.7
2.244
0.641
0.8
2.421
0.692
0.9
2.512
0.712
1.0
2.591
0.740
1.1
2.624
0.749
1.2
2.697
0.771
1.3
2.725
0.779
1.4
2.769
0.791
1.5
2.791
0.797
1.6
2.811
0.803
1.7
2.829
0.808
1.8
2.837
0.811


3. Calculate the cut off frequency using MATLAB. find command will be used. Provide your code.
A=find(z>0.68)
B=x(A);
C=z(A);
D=find(C<0.72);
fC=B(D);
fprintf ('Cutoff Frequency = %1.1f kHz' fc)

the cut off frequency we get from the matlab is 0.9kHz 

Wednesday, March 15, 2017

Week 9

Week 9


Blog Week 9 - Group 2


1. Measure the resistance of the speaker. Compare this value with the value you would find online.

We measured the resistance value of the speaker to be 8.9 Ohms.

2. Build the following circuit using a function generator setting the amplitude to 5V (0V offset). What happens when you change the frequency? (video)


We found that when you increase the frequency, the pitch of the speaker goes way high.  We started the speaker off at 10K output with 5.00 Volts, and 1000KHz.  As we increase the frequency, the pitch of the speaker goes higher. 
Frequency
Observation
1 Hz
No sound
10 Hz
Very soft sound
0.1KHz
Vibrating
1kHz
Quite, high pitched tone
5kHz
Louder, higher pitched tone
10kHz
Very high pitched tone

3. Add one resistor to the circuit in series with the speaker (first 47 Ω, then 820 Ω). Measure the voltage across the speaker. Briefly explain your observations.

Resistor valueOscilloscope outputObservation
47 Ω
1.5V peak to peak
As we increase the frequency from the function generator, the frequency across the speaker increase.
820 Ω
1.5V peak to peak
Peak to peak voltage across the speaker increases as amplitude of input voltage increases.

4. Build the following circuit. Add a resistor in series to the speaker to have an equivalent resistance of 100 Ω. Note that this circuit is a high pass filter. Set the amplitude of the input signal to 8 V. Change the frequency from low to high to observe the speaker sound. You should
not hear anything at the beginning and start hearing the sound after a certain frequency. Use 22 nF for the capacitor.


a. Explain the operation. (video)


The function generator is connected to the capacitor, which is connected to a resistor and the speaker in series which has an equivalent resistance of 100 Ohms.  As we increase the frequency, the speaker pitch slowly - and I mean, very slowly - increases.  We didn't hear any sound from the speaker until 1.17 KHz.  But, this could be different by person as everyone's threshold of hearing is slightly different.
b. Fill out the following table by adding enough (10-15 data points) frequency measurements. Vout is measured with the DMM, thus it will be rms value.
Frequency( kHz)
Vout (V)
Vout/Vin( V)
0
.461
.082
10
.612
.109
20
1.22
.210
40
2.09
.375
60
2.78
.452
70
2.92
.508
80
3.08
.535
90
3.24
.558
100
3.34
.576
110
3.39
.588


c. Draw Vout/Vin with respect to frequency using Excel.


d. What is the cut off frequency by looking at the plot in b?
the cut off frequency is going to be the nearest number to the 0.707V which comes from (1/sqrt2) which is 70 kHz


5. Design the circuit in 4 to act as a low pass filter and show its operation. Where would you put the speaker? Repeat 4a-g using the new designed circuit. 

Frequency (kHz)
Vout( V)
Vout/Vin (V)
10
5.44
.954
20
5.19
.920
40
4.7
.818
50
4.3
.753
60
4.03
.689
70
3.64
.634
80
3.34
.557
90
3.12
.524
100
2.76
.503
110
2.54
.469

the cut off frequency is 90kHz here in the low pass filters based in the plot above.

6. Construct the following circuit and test the speaker with headsets. Connect the amplifier output directly to the headphone jack (without the potentiometer). Load is the headphone jack in the schematic. “Speculate” the operation of the circuit with a video